On this page
- The Problem: Following NgRx Actions by Hand
- High-Level Architecture
- Installation and Quick Start
- Common Workflows
- Complete Flag Reference
- Tips for Large Projects
- Under the Hood: Solving the AST and Graph Hard Problems
- Challenge 1: Static Analysis of RxJS Chains in Effects
- Challenge 2: Resolving Barrel File Aliases
- Challenge 3: Graph Noise and Reachability Filtering
- Technical Stack and Architectural Decisions
- Real-World Examples and Edge Cases
- Case 1: Basic Action Flow
- Case 2: Nested Actions
- Case 3: Reachability Filtering in Disconnected Graphs
- Case 4: Aliases and Re-exports
- Edge Case: Conditional Dispatches
- Edge Case: Multi-Level Re-exports
- Why a CLI Tool Outperforms Browser Visualizers
- Where ngrx-graph Pays Off in Production
- Try It
ngrx-graph: Static Analysis and Graph Visualization for NgRx Applications
 Ammar Najjar · Posted on July 31, 2026 · 13 min readangular
 AI-generated image
If you have ever traced an action through a sprawling NgRx codebase, wondering which effect listens to it, which reducer handles it, and whether some other effect silently dispatches another action in the chain, you know the pain. Manual code traversal works until it does not. One missed dispatch() call buried in a mergeMap. Your mental model breaks.
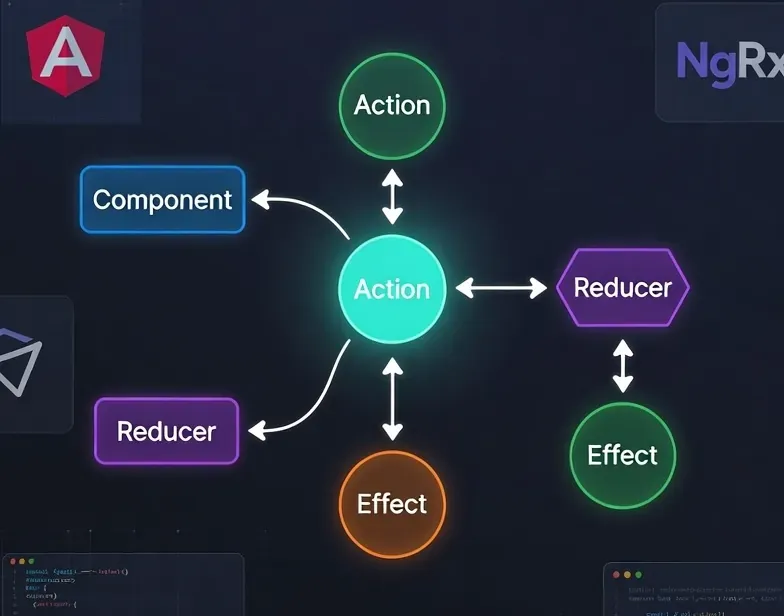
ngrx-graph is a CLI tool that turns that chaos into pictures. It scans your Angular NgRx project, builds a structured JSON representation of every Component, Action, Effect, and Reducer, and generates DOT and SVG graphs that make action flows visible at a glance.
The Problem: Following NgRx Actions by Hand
NgRx is powerful. It gives you a predictable state container with clear separation of concerns: actions describe what happened, effects handle side effects, reducers decide how state changes. In theory, the data flow is clean.
In practice, large NgRx applications accumulate dozens (sometimes hundreds) of actions. Effects chain actions together. Components dispatch actions that trigger effects that dispatch more actions. Reducers listen to specific action types. And somewhere in the middle, an action gets aliased through a barrel export and re-exported under a different name.
Here is what the typical debugging session looks like:
- You find a
dispatch(SomeAction)in a component. - You search for where
SomeActionis handled: maybe an effect, maybe a reducer. - The effect does something and dispatches
AnotherAction. - You repeat the process for
AnotherAction. - Three levels deep, you lose track.
This is not a theoretical problem. In production NgRx codebases, action chains routinely span 3 to 5 levels of indirection. Effects compose effects. Nested actions (actions created by dispatching other actions) add another layer. The mental overhead is real, and it leads to bugs: missed dispatches, stale state, and duplicate logic.
What you need is a map. Not a diagram someone drew once and forgot to update: a generated map, built from the actual source code, every time.
Without ngrx-graph: 15 minutes across 8 tab switches in VS Code tracing
ofType(), barrel exports, anddispatch()calls.With ngrx-graph: Run
npx ngrx-graph "LoadUsers" --svgand inspect the complete execution path in 2 seconds.
High-Level Architecture
ngrx-graph is a Node.js CLI built with oclif. The pipeline runs in three stages:
- Scanning: TypeScript Compiler API parses source files, extracting action definitions, effect chains, reducer handlers, and component dispatches via AST traversal.
- Intermediate JSON: All scan results serialize to
ngrx-graph.json, a canonical representation that decouples scanning from rendering. - Graph Generation: The JSON feeds into Graphviz DOT generation, with optional SVG rendering via native
dotor a WASM fallback.
Source Files --> AST Scanners --> ngrx-graph.json --> DOT/SVG Renderer
     |               |                  |                    |
  *.ts files    p-limit workers    canonical format    Graphviz or viz.js
Each stage is independently usable. You can stop after JSON to inspect scanner output. You can reuse the DOT files with any Graphviz-compatible tool. The architecture keeps concerns separated so that improvements to scanning do not ripple into rendering and vice versa.
Installation and Quick Start
Install globally or use npx:
npm install -g ngrx-graph
# or
npx ngrx-graph ...
Common Workflows
# JSON only: inspect what the scanner finds
ngrx-graph -d ./src --out ./out
# writes: ./out/ngrx-graph.json

# Focused graph for a specific action
ngrx-graph "LoadUsers" -d ./src --out ./out --svg
# writes: ./out/LoadUsers.dot + ./out/LoadUsers.svg

# Full project graph
ngrx-graph -a -d ./src --out ./out --dot --svg
# writes: ./out/all.dot + ./out/all.svg

# Force re-scan (bypass JSON cache)
ngrx-graph -d ./src --out ./out -f
Complete Flag Reference
| Flag | Short | Description |
|---|---|---|
--dir | -d | Directory to scan (default: cwd) |
--out | -o | Output directory for ngrx-graph.json |
--json | -j | Scan and write JSON only, no DOT/SVG |
--dot | Generate DOT files (per-action + aggregated) | |
--svg | -s | Generate SVG files from DOT |
--viz | Prefer viz.js (WASM) for SVG when dot binary is unavailable | |
--all | -a | Generate only the aggregated all.dot |
--concurrency | -c | Parallel file parsing workers (default: CPU count - 2) |
--force | -f | Force re-scan, ignore cached JSON |
--verbose | -v | Enable verbose logging |
Tips for Large Projects
For codebases with thousands of files, a few practices make the difference between a 2-second scan and a 20-second one:
- Start with JSON: Run
ngrx-graph -d ./src --jsonfirst to inspect what the scanner finds. Reviewngrx-graph.jsonbefore generating graphs. - Cache by default: Subsequent runs reuse the existing JSON. Only pass
--forceafter significant refactors. - Tune concurrency: On CI machines with limited CPU, lower concurrency with
--concurrency 2to avoid resource contention. - Use
--vizwithout Graphviz installed: The--vizflag uses viz.js (a WASM/JS renderer) instead of the nativedotbinary. Falls back gracefully. - Focus your graphs: The
--allflag produces the full project graph. For debugging a specific action, always pass the action name to get a focused subgraph. Full graphs with 500+ nodes are technically correct but practically unreadable.
Under the Hood: Solving the AST and Graph Hard Problems
Building a reliable NgRx action graph from static source analysis required solving three non-trivial engineering problems. Each one defeated naive approaches and demanded a deliberate algorithmic solution.
Challenge 1: Static Analysis of RxJS Chains in Effects
Effects are the hardest part of the graph. A typical effect looks like this:
loadUsers$ = createEffect(() =>
  this.actions$.pipe(
    ofType(loadUsers),
    switchMap(() =>
      this.userService.getAll().pipe(
        map(users => loadUsersSuccess({ users }))
      )
    )
  )
);
The scanner must determine two things: which actions enter via ofType(), and which actions exit via dispatch() or return inside operator callbacks. The difficulty is that RxJS operators are deeply nested callback functions (the same operators I introduce in my observables primer). The action dispatched inside map() or mergeMap() is not a sibling of the ofType() call; it is several levels of function nesting deeper.
The solution is a recursive AST walk over CallExpression nodes. Starting from each createEffect() body, the scanner identifies pipe() calls, walks each operator argument, and matches ofType invocations to extract input actions:
// Conceptual AST node traversal for Effect inputs
if (ts.isCallExpression(node) && node.expression.getText() === "ofType") {
  const inputAction = node.arguments[0]?.getText();
  // Register input action...
}
When the walker encounters map, mergeMap, switchMap, concatMap, or exhaustMap, it descends into the callback body. Inside the callback, it searches for dispatch(SomeAction) calls and return SomeAction expressions, recording each as an output action.
This approach handles arbitrarily nested operator chains: pipe(switchMap(() => pipe(map(X), tap(() => dispatch(Y))))) resolves correctly because the walker does not care about nesting depth. It tracks the chain structurally, not textually.
The scanner also handles the common pattern where an effect dispatches an action conditionally. Every dispatch() call within the operator body, regardless of its position in if/else branches, is captured as a possible output. This is conservative by design: it is better to show an action that might fire than to miss one that does.
Challenge 2: Resolving Barrel File Aliases
Angular projects commonly organize actions in dedicated files and re-export them through barrel files (index.ts). The problem arises when re-exports use aliases:
// actions/user.actions.ts
export const loadUsers = createAction('[Users] Load');
export const loadUsersSuccess = createAction('[Users] Load Success');
// index.ts
export { loadUsers, loadUsersSuccess as usersLoaded } from "./actions/user.actions";// user.effects.ts
import { usersLoaded } from "../";The effect references usersLoaded, but the canonical action name is loadUsersSuccess. A naive scanner treats these as two unrelated actions. The graph fractures into disconnected subgraphs, and the user sees an incomplete picture.
ngrx-graph solves this with an in-memory canonical symbol table built during the scanning phase:
- Declaration scan: First pass identifies all
createAction()calls and records their canonical names and source file locations. - Re-export scan: Second pass walks all
index.tsfiles, parsingexport { X as Y }andexport { X }patterns. For each re-export, it maps the alias (Y) back to the canonical name (X). - Resolution: When any scanner encounters an imported action name, it checks the symbol table. If the name is an alias, it resolves to the canonical name before recording it in the graph.
This three-pass approach handles multi-level re-exports (A re-exports from B which re-exports from C) and mixed alias patterns. The symbol table is the single source of truth for action identity across the entire codebase.
Challenge 3: Graph Noise and Reachability Filtering
A project-wide NgRx graph with hundreds of actions is not useful. The node count makes DOT layouts unreadable, and most nodes are irrelevant to whatever you are investigating. The engineering problem is extracting a meaningful subgraph from a large directed graph.
[ Disconnected Action ]   [ Angular Component ]
           |                        |
           x               ( Target Action )  <-- BFS Root
                              /        \
                     [ Effect 1 ]    [ Reducer ]
                          |
                  [ Output Action ]
ngrx-graph models the state flow as a directed graph G=(V,E) where vertices are components, actions, effects, and reducers, and edges represent dispatch, handling, and processing relationships. When a user requests a focused graph for action A, the tool runs a bidirectional Breadth-First Search (BFS):
Forward traversal: Starting from A, follow edges to discover all actions triggered by effects that listen to A, then all actions triggered by effects listening to those actions, and so on. This captures the full downstream chain.
Backward traversal: Starting from A, follow edges in reverse to discover which components dispatch A and which effects produce A. This captures the upstream context.
The union of both traversals produces the minimal subgraph that contains A and everything reachable from or to it. Unreachable actions, effects, and reducers are excluded. The result is a focused, readable graph that shows exactly the flow relevant to the action under investigation.
The BFS implementation uses an adjacency list representation for O(V+E) traversal complexity. For projects with 500+ actions and 200+ effects, the focused graph typically contains 10 to 30 nodes, making it immediately readable.
Technical Stack and Architectural Decisions
Every library choice in ngrx-graph was made with a specific constraint in mind. Here is the reasoning behind each one:
| Component | Choice | Why | Alternative Considered |
|---|---|---|---|
| AST Parsing | TypeScript Compiler API (ts.createSourceFile) | Exact AST fidelity for TS/TSX. Handles generics, decorators, and type annotations that Babel strips or transforms. No configuration drift between parser and project tsconfig. | Babel: faster but loses type information. Regex: breaks on nested callbacks and aliased imports. |
| Bounded Concurrency | p-limit | Prevents CPU and memory exhaustion on codebases with thousands of files. max(1, CPU_COUNT - 2) workers keep the machine responsive during scans. | Raw Promise.all: unbounded parallelism causes OOM on 10k+ file projects. Sequential: too slow for enterprise codebases. |
| CLI Framework | oclif | Enterprise-grade CLI structure: flag parsing, help generation, plugin system, testing utilities. Battle-tested at Salesforce. | Commander/yargs: lighter but lacks built-in help formatting and test scaffolding. |
| Graph Rendering (primary) | Native Graphviz dot binary | Fastest rendering path. Produces publication-quality layouts. Available in most CI environments. | N/A: this is the reference implementation. |
| Graph Rendering (fallback) | @hpcc-js/wasm (viz.js) | Zero-dependency WASM renderer. When dot is not installed (common in minimal Docker images or CI containers), --viz uses the in-browser Graphviz port. No installation required. | Puppeteer/headless Chrome: heavy, slow, fragile in CI. |
| Output Format | Graphviz DOT | Standard format supported by every graph tool. DOT files are text, diffable, and composable. SVG is a rendering step away. | Custom JSON graph format: would require a custom renderer, losing interoperability. |
The two-tier rendering strategy (native dot first, WASM fallback second) means ngrx-graph works everywhere without forcing users to install system packages. In CI, --viz gives you zero-dependency rendering. On a developer machine, the native binary is faster.
Real-World Examples and Edge Cases
The repository ships with four example cases demonstrating progressively complex scenarios.
Case 1: Basic Action Flow
A simple setup: one component dispatches action1, an effect listens for it and dispatches action2 and action3, and a reducer handles action3.
npx ngrx-graph action1The generated graph shows the full flow: FirstComponent -> action1 -> effect1$ -> action2, action3 -> firstReducer. You see exactly which component started the chain and where it terminates. In enterprise codebases, this is the baseline: verifying that a feature’s action flow is complete end-to-end.
Focusing on action3 instead reveals a narrower slice: only nodes that affect or are affected by that specific action.
Case 2: Nested Actions
Actions can carry other actions in their payloads. Case 2 demonstrates nestedAction1 (containing action1 and action2 as payload actions) and nestedAction2. The graph distinguishes nested actions with a light cyan fill, making the composition pattern visually obvious.
This matters in large NgRx projects where action composition is a common pattern for orchestrating multi-step workflows. Without visual distinction, nested actions are easy to miss during code review.
Case 3: Reachability Filtering in Disconnected Graphs
When actions are disconnected (action2 exists but is not reachable from action1 through any effect chain), the focused graph correctly excludes it. Without reachability filtering, focused graphs would be noisier than useful. This is critical for enterprise codebases where hundreds of actions coexist but only a subset participate in any given flow.
The BFS algorithm ensures that the output is the minimal subgraph. No dangling nodes, no irrelevant edges. The difference between a focused graph and an aggregated graph in a 300-action project is the difference between a readable map and a wall of ink.
Case 4: Aliases and Re-exports
Real projects re-export actions through barrel files:
// index.ts
export { actionB, actionA as exportedActionA } from "./case4.actions";
Effects import the alias:
import { exportedActionA } from "./index";ngrx-graph resolves these aliases back to the original action names, so the graph shows the canonical flow rather than breaking at re-export boundaries. In monorepo architectures with shared action libraries, alias resolution prevents the graph from fragmenting into disconnected subgraphs.
Edge Case: Conditional Dispatches
Effects sometimes dispatch actions conditionally:
loadUsers$ = createEffect(() =>
  this.actions$.pipe(
    ofType(loadUsers),
    switchMap(() =>
      this.userService.getAll().pipe(
        map(users => users.length > 0
          ? loadUsersSuccess({ users })
          : loadUsersEmpty()
        )
      )
    )
  )
);
Both loadUsersSuccess and loadUsersEmpty appear as outputs. The scanner captures every possible dispatch path, ensuring no action is silently dropped from the graph.
Edge Case: Multi-Level Re-exports
In monorepos, actions may pass through multiple barrel files:
core/actions.ts --> core/index.ts --> feature/index.ts --> feature.effects.tsThe canonical symbol table resolves chains of aliases at any depth. The graph always shows the original action name regardless of how many re-export layers sit between the declaration and the usage.
Why a CLI Tool Outperforms Browser Visualizers
Several tools visualize NgRx state, but they serve different needs:
- ngrx-visualizer (Google): A web-based tool for interactive exploration. Requires manual graph construction in a browser. Works well for small projects, less practical for CI/CD pipelines or large codebases.
- ngrx-graph: A CLI-first tool designed for automation. Parses actual source code via AST, handles aliases and nested actions, supports focused graphs with reachability filtering, and outputs standard DOT/SVG files for integration into documentation pipelines.
The key differentiator is focused action graphs. Most visualization tools show the entire state graph at once. In a large project, that produces an unreadable web of nodes. ngrx-graph traces a single action through the full flow, showing only reachable nodes, which is where the debugging value lives.
Where ngrx-graph Pays Off in Production
Code review: Generate a focused graph for a new action to verify the full flow exists. A missing reducer handler or effect subscription becomes visually obvious.
Onboarding: New team members examine a project-wide graph to understand the state management architecture without reading every file. It is a living architecture diagram.
Debugging production issues: When a bug traces to stale state, generate a graph for the suspected action chain. You will quickly see if a reducer is missing a handler or if an effect dispatches an unexpected action.
Refactoring: Before renaming or removing an action, generate its focused graph to see every dependency. No surprise breakages.
Try It
npx ngrx-graph -d ./src --out ./out --svgOne command. One graph. Your NgRx store stops being a black box.
Links:
Contributions welcome. Open an issue if something breaks, or a pull request if you want to fix it.